 Shopping around for a Big Data analytics solution is a daunting task for anyone. But for those who are somewhat familiar with data science, a common area of misunderstanding — and underestimating — is clustering techniques. Whether the assumption is that all clustering techniques are created equal or that a company needs only one or two clustering techniques, business buyers are often left scratching their heads. The fact is several types of clustering techniques exist — each with its own strengths and weaknesses — and companies need access to a variety of techniques to accomplish optimal results.
What Is Clustering?
Clustering is a type of machine learning technique that automatically groups incoming data points, such as information about customers, into natural clusters based on their attributes, such as location, age, household income, or buying patterns. It is widely used in marketing to find naturally occurring groups of customers with similar characteristics as opposed to forcing customers into segments based on top-down rules. These clusters are discovered using hundreds of parameters, resulting in customer segmentation that more accurately depicts and predicts customer behavior, leading to more personalized sales and customer service efforts.
Different techniques work best for different types of data. Imagine your input data distributed in the scatter plot below: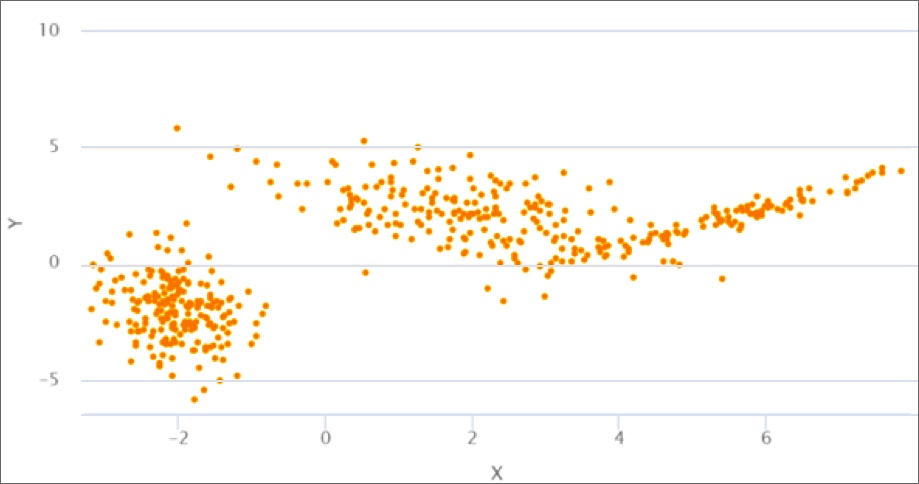
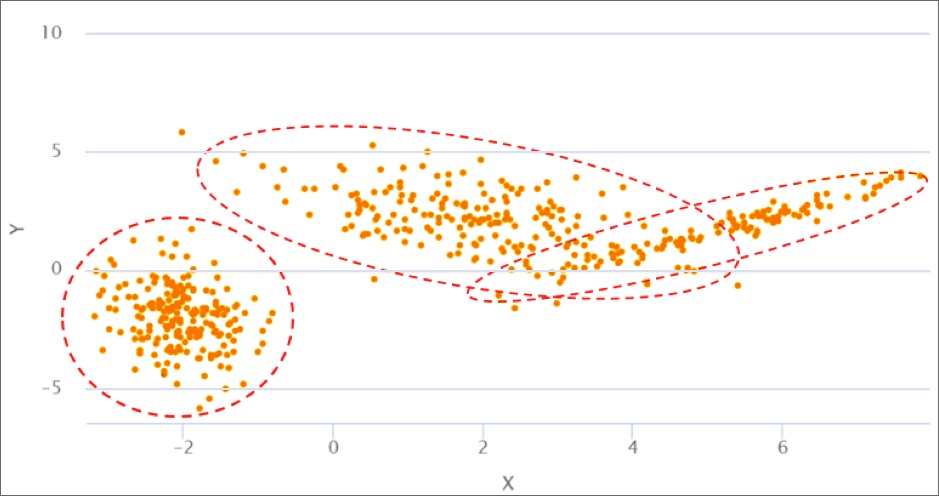
Scatter plots are commonly used to measure and analyze similarities between values of variables for one or more data sets. Normally, you would have more than two attributes for each data point, but for simplicity’s sake, let’s stick with this two-dimension example. At first glance, the scatter plot above looks to be illustrating two clusters, with each cluster appearing as a blob. But in reality, it has three clusters and should look like this:
K-means
To properly define the cluster boundaries, a scientist might try a clustering technique called k-means. K-means is a popular technique that works well when clusters are well separated. However, when we apply k-means here, we get the following result:
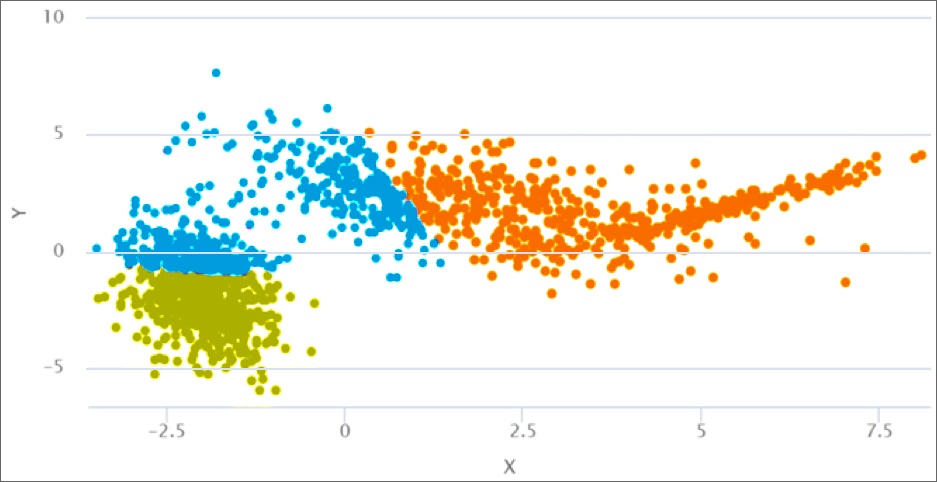
Clearly, the model is not doing so well, drawing sharp boundaries straight through the blobs. But the algorithm works as designed. When it tries to find cluster centers and identify which dots belong to which cluster, it uses a relatively simple formula called an objective function, which assumes the clusters are approximately round, and it does not deal well with noisy data, elongated blobs, or partially overlapping clusters.
Gaussian Mixture Model (GMM)
The next technique a scientist might try would be a Gaussian Mixture Model (GMM), which works better for this particular data. Conceptually, it works similarly to the way k-means works, but it assumes input variables are a mix of Gaussian (bell-shaped) distributions. As a result, it deals much better with elongated, overlapping, and noisy clusters. The same input data results in a much better cluster definition:
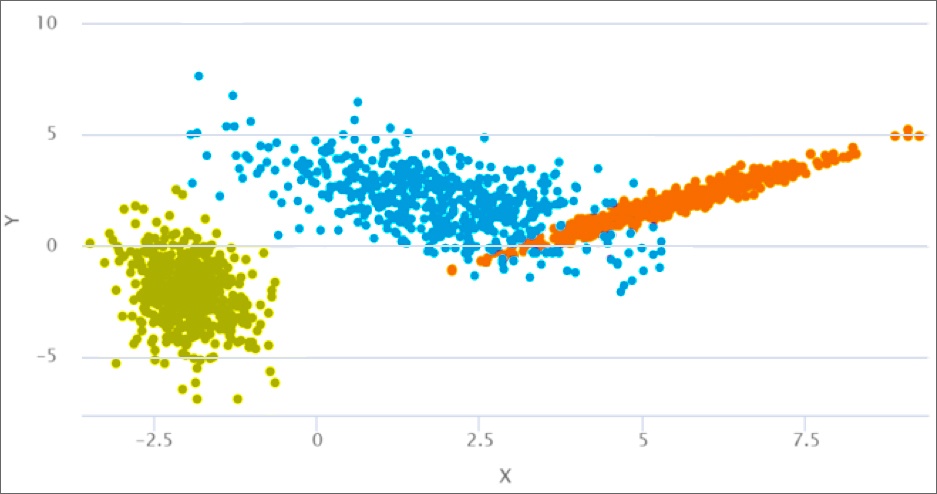
So why would you not always just use GMM instead of k-means? Well, k-means is easier to use and computes faster, which is important for Big Data; you don’t want to wait days to see the result. So many scientists will opt for k-means, so long as it works well enough.
Also, GMM is not a magic bullet. For instance, if your data looks like this...
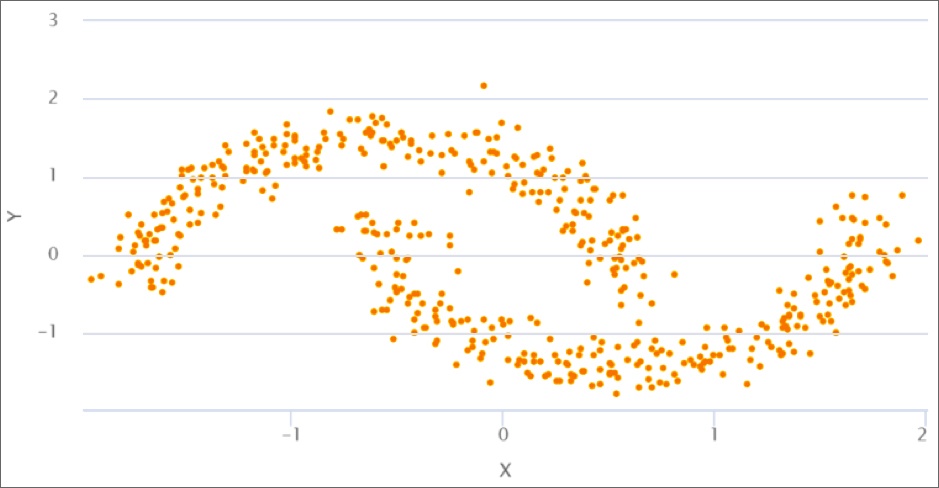
…GMM utterly fails:
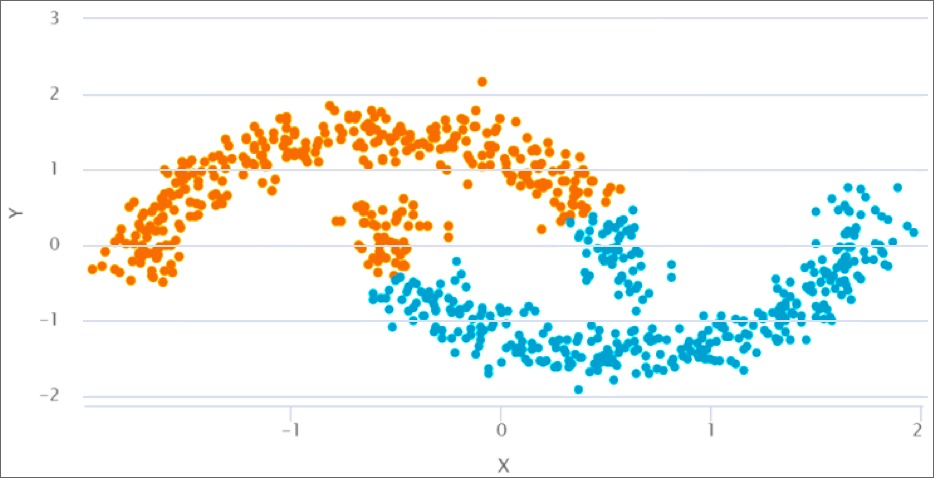
GMM tries to find roundish clusters, but it misses the mark here, cutting the curves at the wrong point.
DBSCAN
Here, DBSCAN (density-based spatial clustering of applications with noise) works better and illustrates the data beautifully:
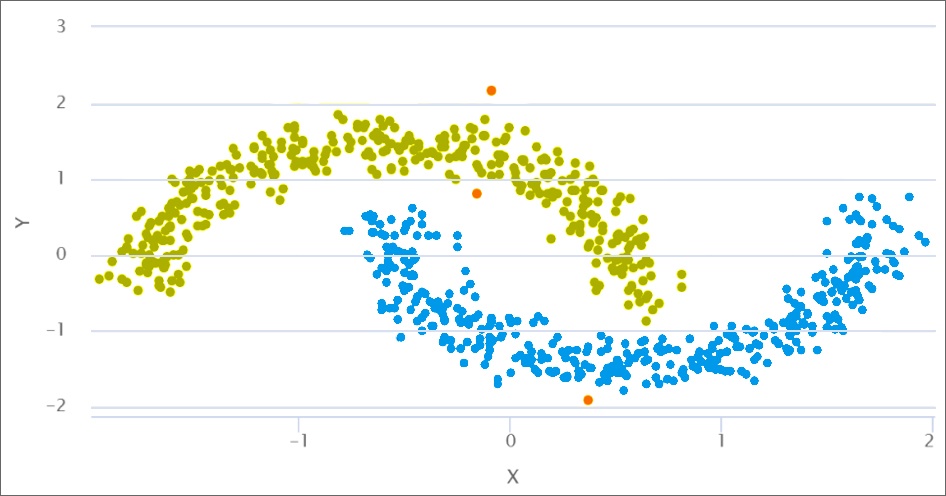
DBSCAN groups together points that are densely packed together. Because of that, it can discover well-defined clusters even from very irregular-shaped distributions (which is what most real-life data is like). The downside is that DBSCAN is more computationally intensive and requires some tuning. For example, it has a parameter that determines how closely the points need to be to be part of the same cluster. If you set it too low, you may get thousands of tiny clusters. If you set it too high, you may get one giant cluster.
Note, if you look closely at the graph, you will see a few orange dots. The machine learning algorithm automatically determined they are not part of the two moon-shaped clusters because they were sufficiently separated from it. So this technique could be used to find natural outliers, for example, in credit card transactions or medical claims applications. DBSCAN is particularly adept at detecting fraud and anomalies.
We would list k-means, GMM, and DBSCAN as the three critical algorithms any company should have at the ready. With these three, you should be able to solve most business clustering problems. That said, there are dozens of more exotic algorithms that may be better suited to a particular problem or data set. For this reason, flexibility is key. The more built-in algorithms your analytics solution has, the better.
Built-In Clustering
If you’re looking for a software solution specifically, we recommend that you choose software with a comprehensive set of built-in algorithms. You never know what data type you will get, and you don’t want to be left piping your data to some outside system for analysis. For example, the popular Spark machine learning library does not have DBSCAN. So if your data looks like the “two moons” example above and you don’t have the right models built in, you may hit a dead end.
You should also choose software that can do fast training. Clustering, like many other machine learning approaches, often requires multiple experiments to find the right parameters for your data set. Users will not have the patience to sweep the parameter space for a painfully slow training session, and they may give up or end up with an unsatisfactory solution. That ultimately affects the accuracy of the model and subsequent business results.
Opera Solutions’ Signal Hub is an advanced analytics software solution that has a comprehensive set of built-in algorithms (including all those mentioned here) and can do fast training. It currently touches more than 500 million consumers and drives data-driven decision making for Fortune 500 companies around the globe. Learn more about Signal Hub and how it might fit into your company in this Signal Hub Technical Brief.

Anatoli Olkhovets is vice president of product management at Opera Solutions.


